
March 2017
Liver ultrasound is something we do every day so we should be good at it, right?
So long since the last update. I didn’t believe anyone read these so my good intentions lapsed long ago. I hear that a few of you peruse this material, so here is some more.
More on livers…. It has become increasingly important to evaluate livers as the incidence of fatty liver and chronic hepatitis has increased. In addition to the standard abdominal views the following are suggested where a better evaluation of the liver is required. There are a substantial number of livers the will have fibrosis and even cirrhosis with nothing to see on a standard 2D scan.

- A high frequency view of the liver surface: subtle nodularity is often the only sign of fibrosis on a standard 2D scan. You can’t tell with a convex array -see image!
- Hepatic artery waveform -this becomes high resistance in cirrhosis.
- Hepatic venous waveform -this becomes abnormal in right heart failure or tricuspid incompetence. If the PV waveform is more pulsatile or the hepatic veins are larger than normal then check the waveform.
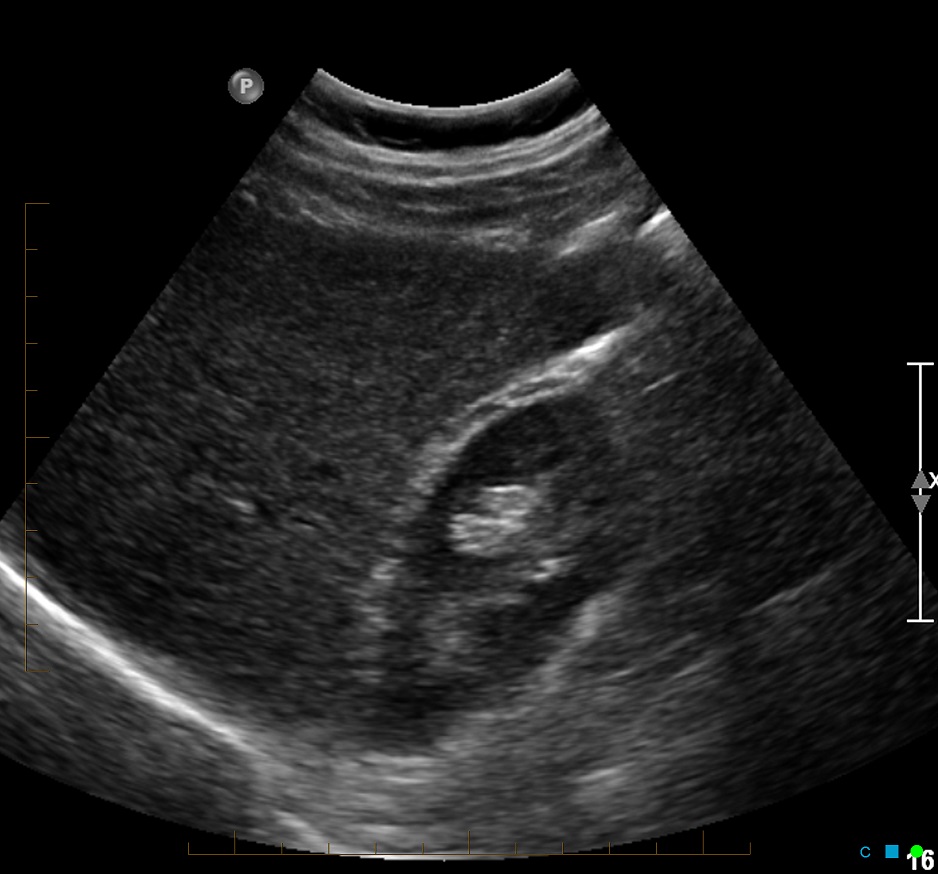
Is the surface nodular? Click for larger image
Of course liver ultrasound can be enhanced with shearwave elastography of the liver as is the best way of assessing for fibrosis and cirrhosis but I understand this remains limited. It also not a procedure you can do occasionally as it takes recurrent use and practice to get consistent and reliable results. At Garran we have done more than of 700 of these but in retrospect the first 50 were not always accurate.
June 2015
This is the first in a series of blogs about basic ultrasound. Fatty livers are very common and yet I am frequently surprised at the variable recognition of this finding. Certainly little effort is made to further categorise this finding, and yet it has major implications for the patient and their health. Unfortunately ultrasound is not accurate in assessing for complications of this condition without the aid of additional tools such as elastography or fibroscan. Nevertheless we are able to broadly categorise the degree of fatty infiltration using some standard references. The more you consciously do this the better you get. Here is my working model.
| MILD | Hyperechoic relative to right kidney. None of the features below. |
| MODERATE | Some loss of visibility of portal tracts and vessels. Bright diaphragm line still clear. +-Fatty sparing present. |
| SEVERE | Above plus loss of clear visibility of diaphragm reflective echo. Dropout of deep liver detail. |
This is a simple grading system for liver ultrasound but given the knowledge that it is crude I will use the following terms in my report that allows leeway give the quality of images and absolute degree of echogenicity.
Mild → mild-to-moderate → moderate → moderate-to-severe → severe.
Fatty change can be associated with significant fibrosis which is better evaluated using shearwave elastography however, this requires specialised equipment.