An update April 2023
We have just scanned patient 847. The full results of our Tc-PSMA SPECT/CT research has now been published in The Prostate http://dx.doi.org/10.1136/ard.49.6.378
An update December 2019
Nicholas Ingold and I started doing Tc-PSMA SPECT/CT scans at GMI in 2016 and have now done about 300. Initially there was a steep learning curve as we worked on improving the technical parameters and image reconstruction, but over time I have become confident that we are producing a high quality and clinically important scan.
As part of my ongoing commitment to R&D I have recently reviewed our data and am pleased to note that the scan quality and more importantly the scan results are close to the benchmarks defined by the world literature on Ga-PSMA PET scans. The results below indicate the accuracy and value of the test.
Detection rates
Our detection rates are higher than the limited publications on Tc-PSMA. Our detection rate for recurrent disease post prostatectomy is shown in the table below.
| PSA (ng/ml) | Number | +SCAN | -SCAN |
| <0.5 | 39 | 23 (59%) | 16 (41%) |
| 0.5-1.0 | 15 | 11 (73%) | 4 (27%) |
| 1.0-5.0 | 51 | 45 (88%) | 6 (12%) |
| >5 | 133 | 130 (98%) | 3 (2%) |
Table 1: Detection rates for recurrent disease Tc-PSMA at GMI 2016-19.
Comparison with MRI
We also had 108 cases in which we had a comparative MRI at staging of the primary disease. As suggested in the literature for Gallium PSMA we found more disease in the prostate than the MRI in a substantial number of cases (table 2 below).
| MRI v PSMA in prostate | Number | % |
| Discordant | 3 | 3.5% |
| Concordant | 36 | 46% |
| More disease on PSMA | 37 | 47% |
| Less disease on PSMA | 3 | 3.5% |
Table 2: Comparison of mpMRI with Tc-PSMA for carcinoma of the prostate
Comparison with Conventional Staging
In 236 cases we had enough data to compare Tc-PSMA with conventional staging (CT scan +-Bone scan). In 145 cases (61%) there was no change. In the remaining 39% staging was altered: 15% upstaged; 13.6% different disease distribution; and 10% down-staged.
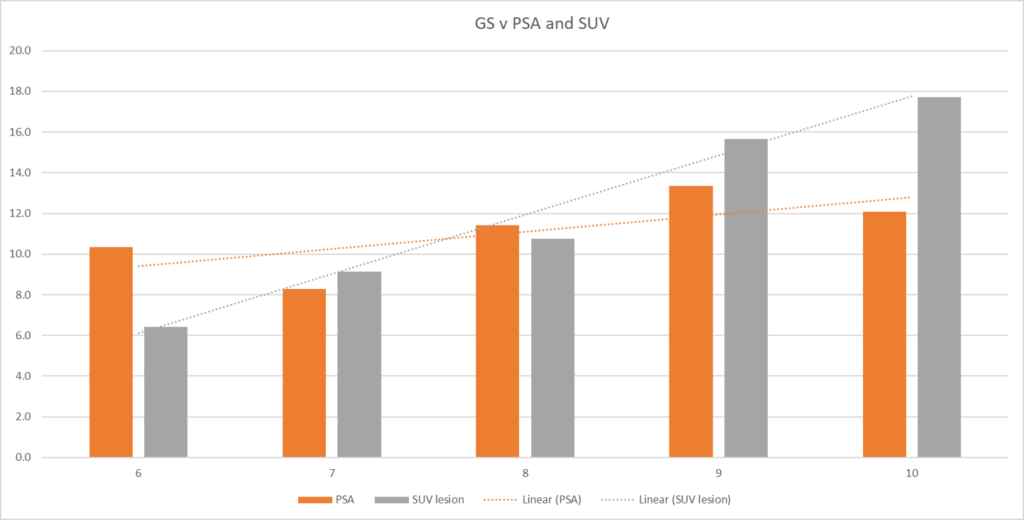
Relationship to Biopsy and PSA levels
We also had enough data to compare serum PSA, Gleason score at pathology, and SUVmax (PSMA uptake) of the principal prostate lesion in 146 cases (Figure 2). This shows a stronger correlation between SUVmax and Gleason score than between PSA and Gleason score (poor correlation).